

Consulting-grade analysis ready in ~10 min
Upload a 10-K or AP spend data. You get a PDF report, an Excel model and a PowerPoint deck with peer benchmarks, sized savings and an action plan.
The first baseline still takes two to three weeks
Before anyone can discuss savings or performance, someone has to collect, clean, classify and benchmark the data.
Weeks go into data preparation
Collecting AP extracts, cleaning supplier names and building a taxonomy takes 9 to 15 days of analyst time.
Results depend on who does the work
Category mapping and lever choice rely on individual judgement, so two teams reach two different answers.
General AI tools are not consistent
Chat tools give unsourced numbers that change from one run to the next, which you cannot put in front of a client or an investment committee.
A first baseline in ~10 min, with the same numbers on every run
ValueChaser classifies, benchmarks and sizes your data against a library built by former consultants. Code computes the figures, and every finding traces back to a line in your data.
150,000+ taxonomy nodes and 1,300+ category playbooks
The library also holds 16,000+ value levers written by former consultants.
Code computes every figure
The same data gives the same result on every run.
Every finding links to its source
Every category, benchmark and saving traces back to your data.
Applies when
- More than 5 suppliers in the category
- Top supplier under 50% share
- Branch prices vary above threshold
Prerequisites
- Supplier master clean-up
- 12 months of spend by branch
Actions
- Match equivalent services across branches
- Run a consolidated pricing request
Watch-outs
- Local coverage gaps
- Supplier capacity limits
How it worksFrom your data to a finished report in three steps
From your data to a finished report in three steps
Upload your data
A 10-K or annual report, or AP and ERP spend extracts as they are. Several files, entities and currencies in one run.
ValueChaser runs the analysis
It classifies spend, benchmarks against matched peers and sizes savings with the category playbooks.
Download the outputs
A PDF report, an Excel model and a PowerPoint deck. Run it yourself in ~10 min, or we run it for you within 24 hours.
ProductsWhat each product delivers
What each product delivers
A health score and peer gaps
Scores financial health across six dimensions, compares the company with matched peers and sizes each profit gap.
Input: Annual reports or financial statements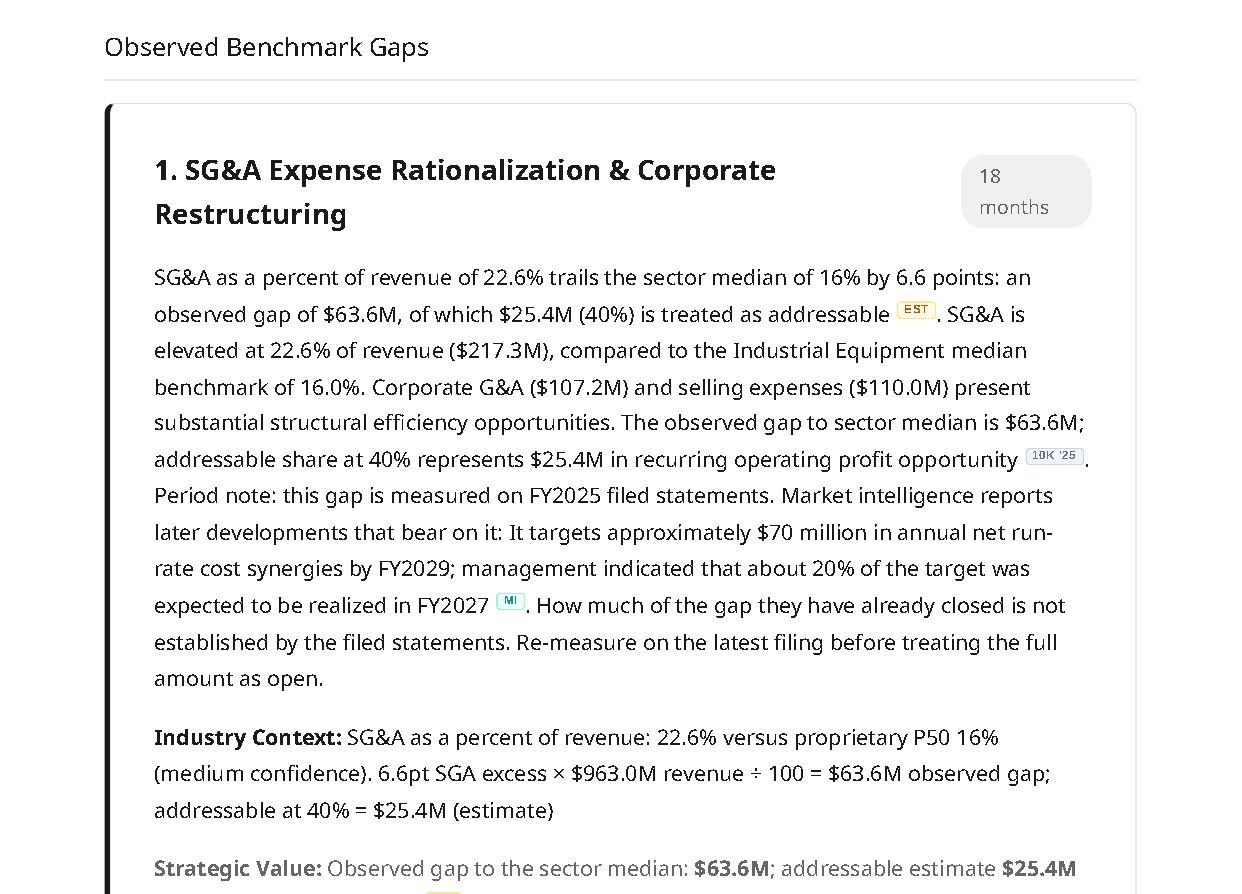
Every transaction classified into a spend cube
Classifies spend from L1 to L4 on 70+ industry taxonomies and groups supplier names into families.
Input: AP or ERP spend extracts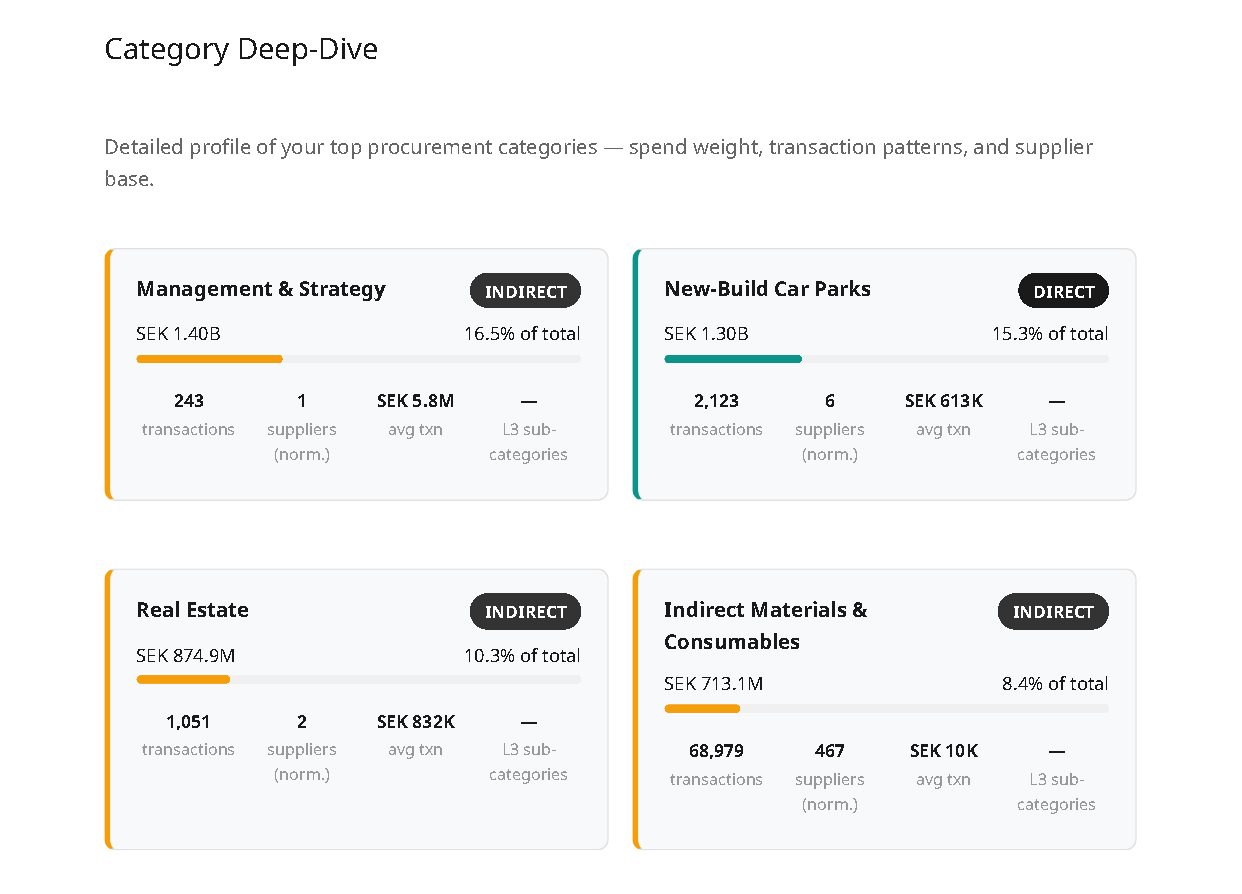
Savings ranges by category and lever
Checks each category against 1,300+ playbooks, sizes the savings and ranks the quick wins.
Input: Categorized spend or AP data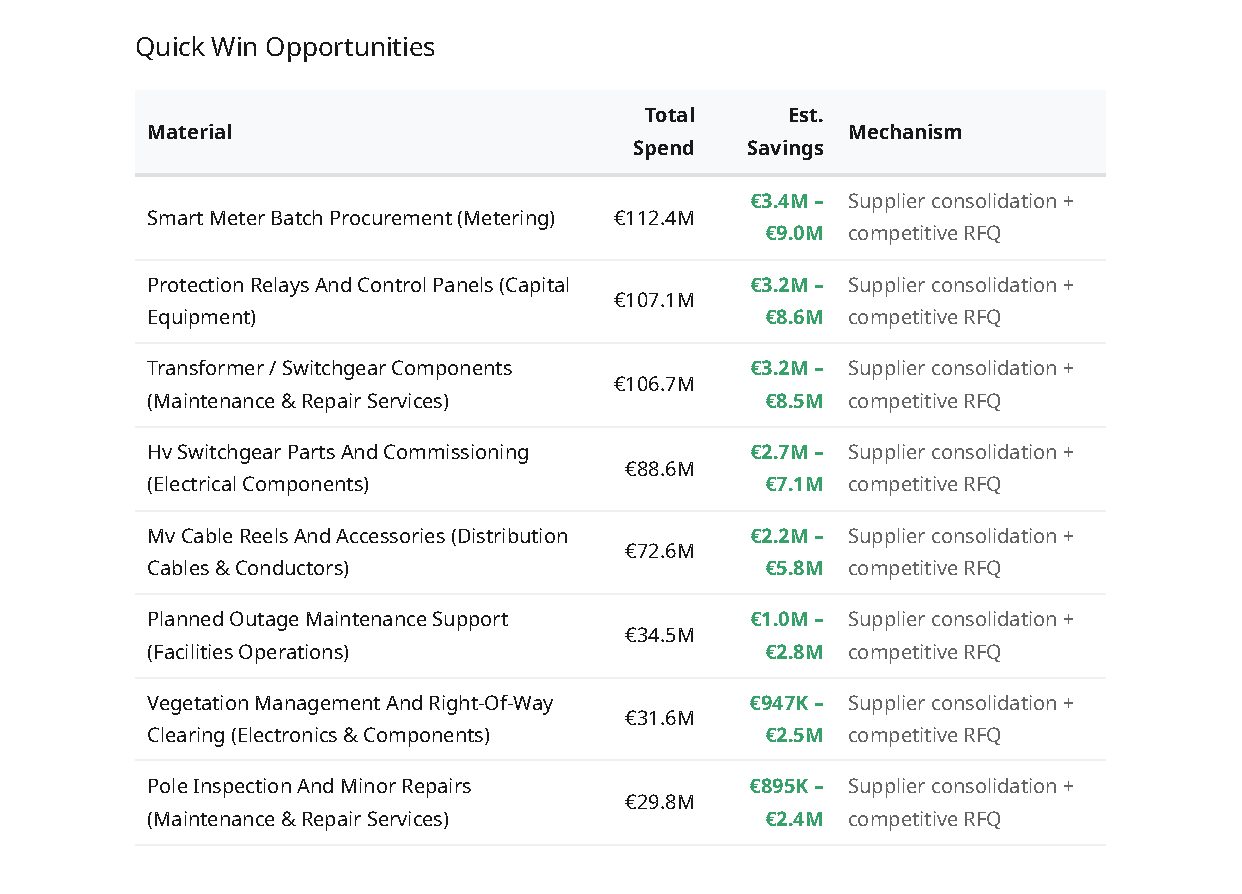
Who it is for
Start the engagement with the analysis done
Your team has the fact base, benchmarks and sized opportunities before the first workshop.
ValueChaser for consulting →Private equityBaseline every portfolio company the same way
Screen targets and size savings without adding analysts.
ValueChaser for private equity →Procurement teamsGo from AP extracts to a spend cube and savings plan
You get categorized spend, supplier families and ranked savings levers.
Spend Categorization →CFOs and business leadersSee where the company stands against its peers
Get a health score and sized gaps to peers from a 10-K or financial statements.
Company Diagnostic →Featured in

How AI is creating a new breed of consultants
Watch the episode →
Turning raw business data into consulting-grade insights
Listen to the conversation →
Listed in the directory powered by The Hackett Group
View the listing →Try it on your own data
Run it yourself in ~10 min, or we run it for you within 24 hours. $4,700 a month for unlimited reports, or $900 per report. PricingLatest insights
All insightsCommon questions before a first run

Run it yourself and the report arrives in about 10 minutes. When our team runs your data for you, the completed report is delivered within 24 hours.
For a Company Diagnostic, a 10-K or audited financial statements. For Procurement Categorization and Procurement Insights, a raw AP or spend export. The platform checks the data before the run and shows what is missing, and you only pay when the data passes.
Practitioners curate the benchmarks, taxonomies and playbooks the platform uses. Results below a confidence threshold are flagged for review, and our team audits outputs regularly.
A general AI tool writes text in answer to a prompt. ValueChaser runs your data through a patent-pending workflow that combines several AI models with curated taxonomies, benchmarks and category playbooks. Calculations are done in code, every figure traces back to your data, and the outputs are a PDF report, an Excel model and a PowerPoint deck.
Yes. Data is encrypted in transit and at rest and is never used to train AI models. The platform is hosted on providers with SOC 2 Type II reports. Files from one-time runs are deleted 3 days after delivery, and subscriber uploads after 30 days. You can ask for deletion at any time at contact@valuechaser.ai, and the Data Security page has the full detail.
Yes. Pay As You Go is $900 per report, invoiced monthly. Monthly Unlimited is $4,700 per month on an annual agreement. Both include 10 users, report history and the option to have our team prepare and run the analysis for you, and subscribers can be introduced to practitioners who help act on the findings. The Pricing page has the details.
